A location that works
Compare spots based on entry direction, manoeuvring space, buildings, greenery, surfaces and terrain.
AI property analysis
Space for your car. Potential for solar.
Different locations offer different possibilities. Compare carport placements for energy production, shade, vehicle access and available space. Your AI assistant helps match a model, forecasts energy for the leading options and prepares a visualization and PDF report.
Check your property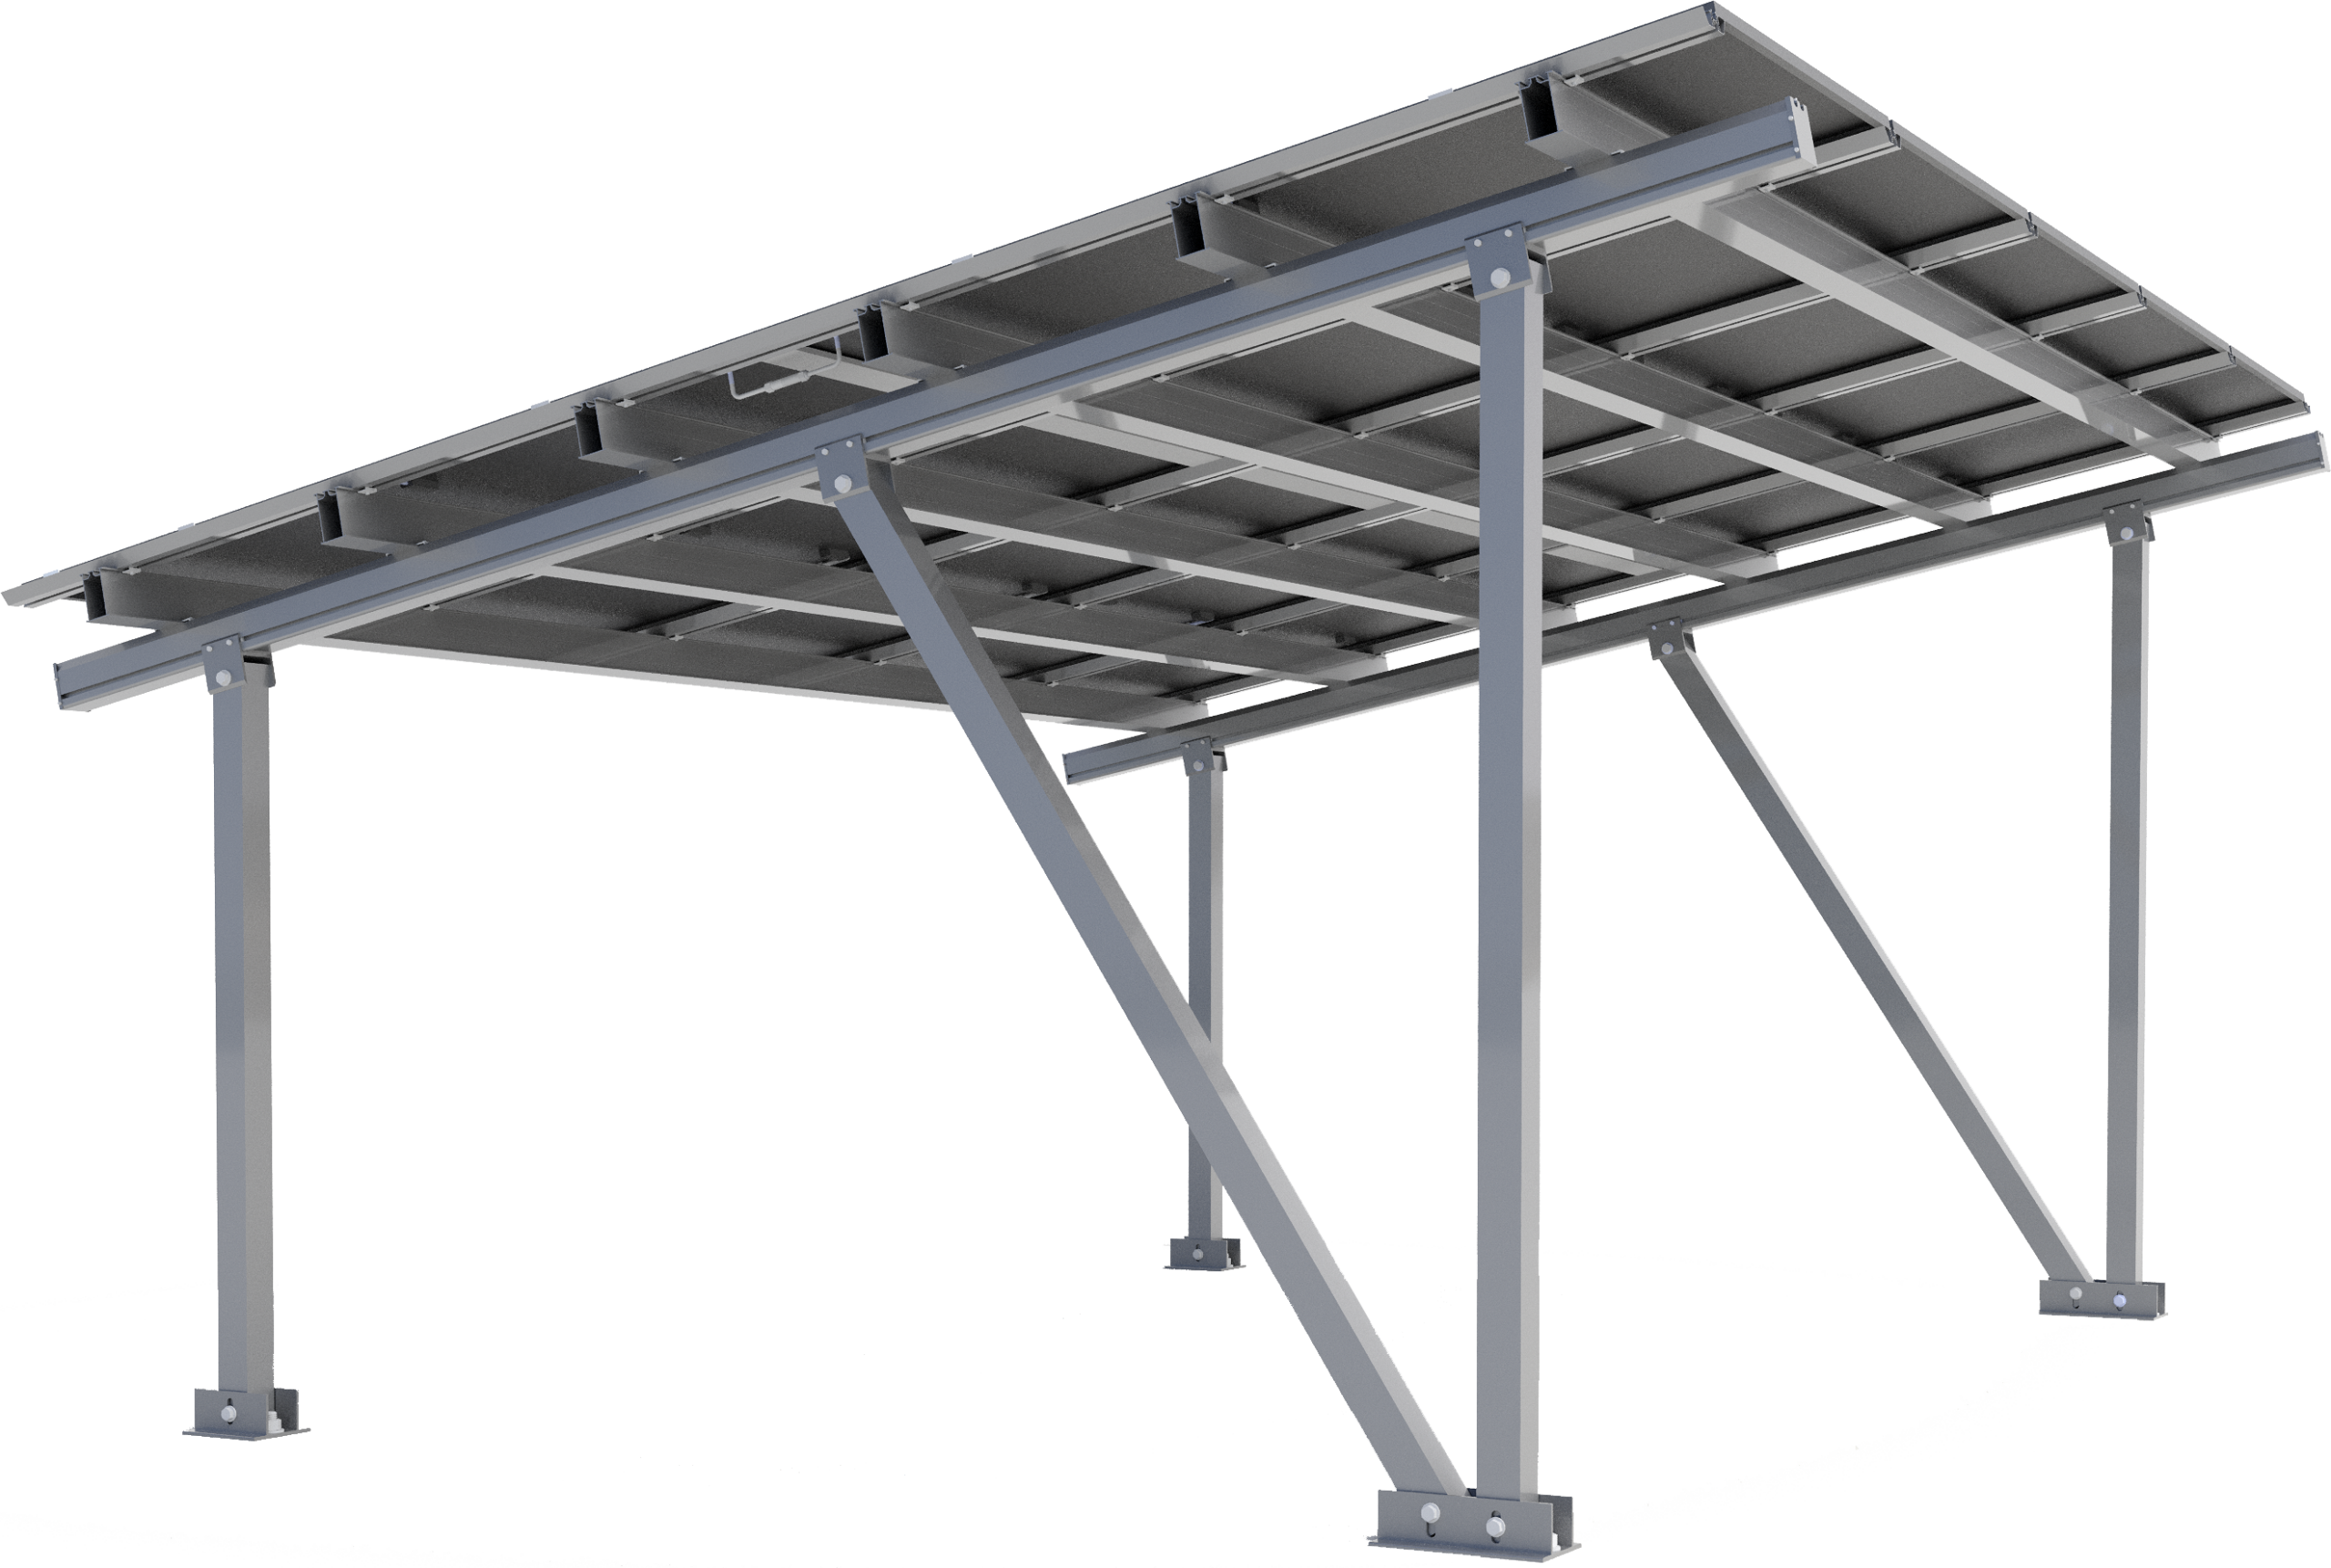
MP OZE SOLO · 6,30 kWp
Compare spots based on entry direction, manoeuvring space, buildings, greenery, surfaces and terrain.
Explore annual and monthly forecasts for the leading placements, plus shade maps for different seasons.
A visualization, placement comparison, energy forecast and initial estimate in a PDF report, ready to discuss with your supplier.
The same six steps as the configurator. First, your property and needs. Then compare placements, energy and shade — before viewing the visualization and collecting your report.
Click an image to explore the details.
Step 1 of 6
Enter an address or parcel ID, or select a point on the map. Choose your property from the search results.
Step 2 of 6
Check the parcel boundary, visible buildings and data source. Confirm the outline or mark the area manually if it needs correcting.
Step 3 of 6
Choose the number of parking spaces, EV charging plans and existing solar installation. Add your surface, timeline, budget and whether this is a private or business project.
Step 4 of 6
Choose a carport model and check its footprint at actual scale. Position and rotate it manually, or continue to the AI assistant for suggested placements.
Step 5 of 6
This is where analysis happens. Explore suggested placements, energy forecasts and seasonal shade first. After choosing a location, start the visualizations and PDF preparation.
Recognition → Energy → Shade → Visualizations
The assistant detects buildings, trees, access and surfaces. It compares spots for vehicle access, manoeuvring space, available ground, terrain and solar potential.
Compare estimated production for the leading placements. A monthly chart shows how output changes across the year, using available shade data.
Saved result · 2.4 m · 9 am–3 pm
Explore the same property on 21 March, 21 June and 21 December. The maps show where shade falls and how it changes with the seasons.
After reviewing energy and shade, choose a location and start the visualizations. Get a top-down plan, an illustrative ground-level view and a prepared PDF.
Step 6 of 6
Collect your summary, placement comparison, energy forecast, visualizations and PDF. Review the notes and initial estimate, then send an enquiry to your chosen supplier.
One property, each stage of planning. Aerial imagery: GUGiK / Geoportal.gov.pl
MP OZE
6 × 4.855 m · 2 spaces
6.30 kWp · modules: 10
Catalog price: PLN 26,499.00 gross, recorded on 2026-09-29. This is not a final site-specific quotation.
Declared offer scope: structure, PV, EV charger. Confirm each item and its cost in the quotation.
Price per kWp: PLN 4,206.19/kWp gross
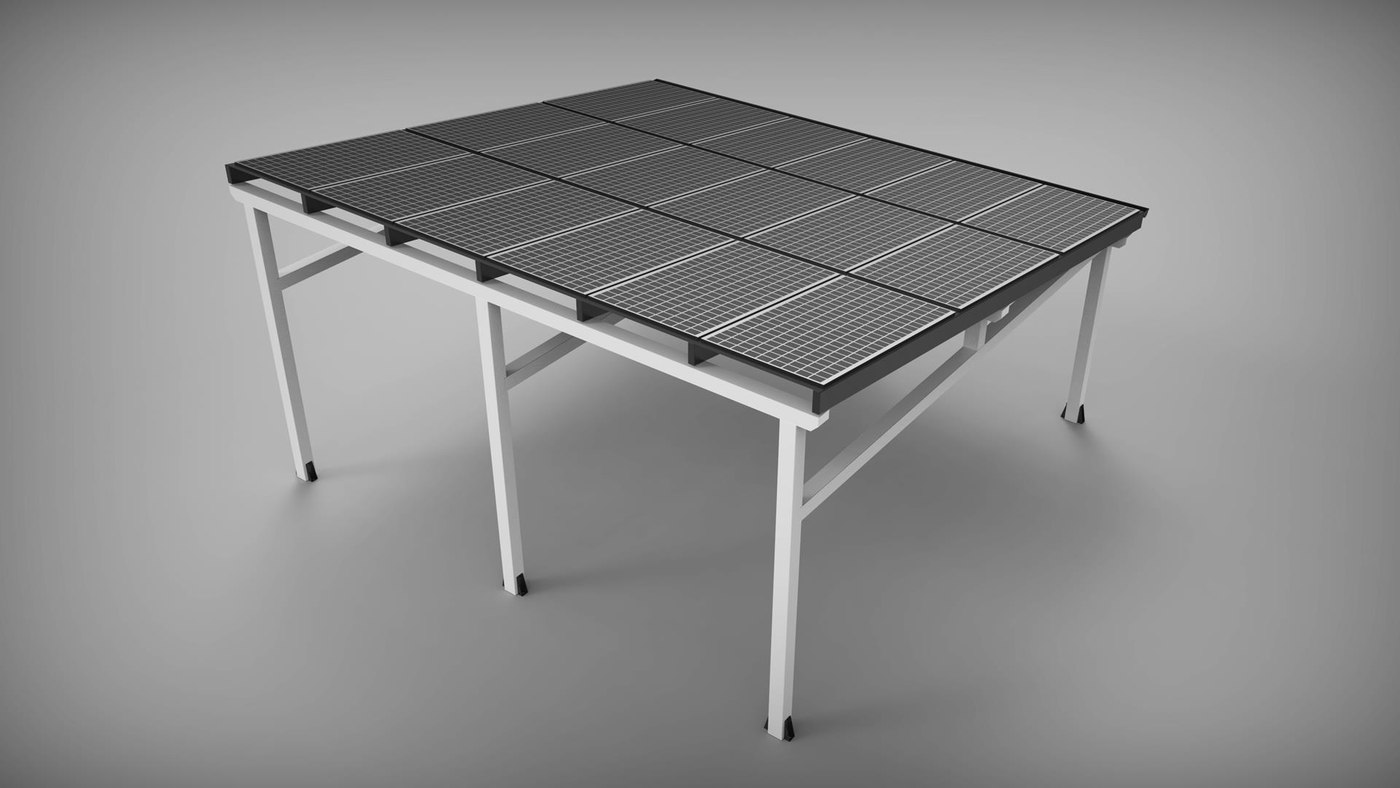
WIATEX
6 × 6 m · 2 spaces
PV-ready structure. Panels and the PV installation are specified and priced separately.
Individual quotation required.
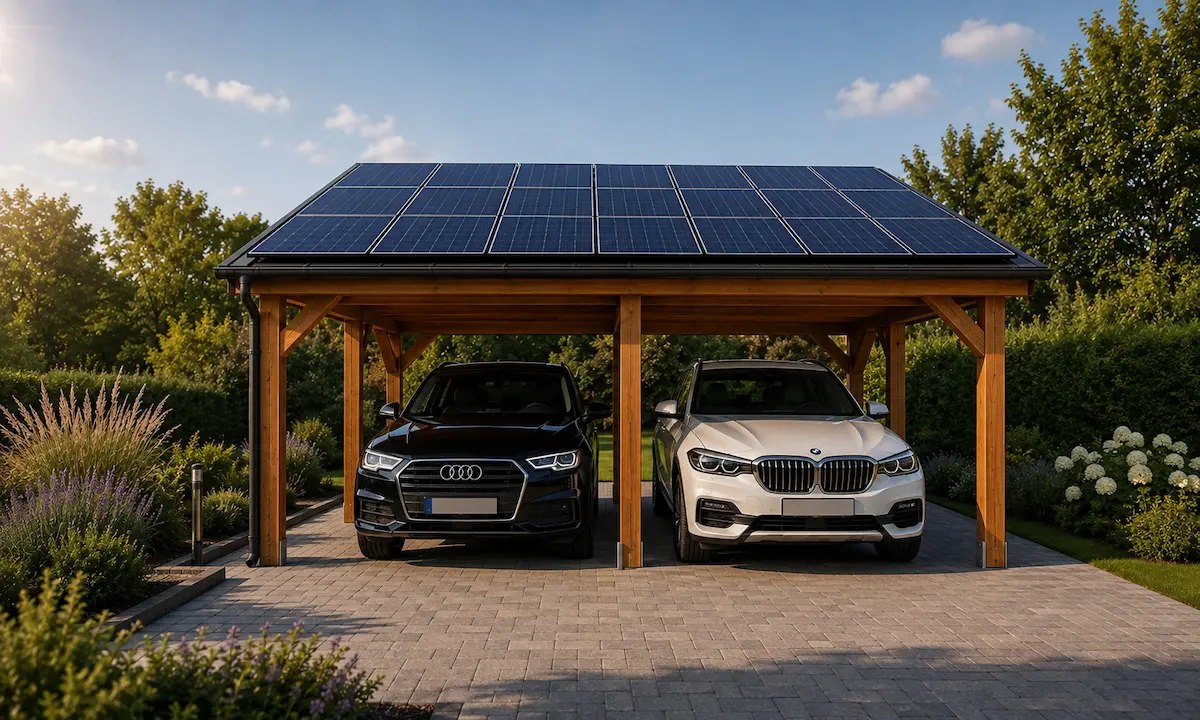
WIATEX
Dimensions tailored to the project
PV-ready structure. Panels and the PV installation are specified and priced separately.
Individual quotation required.
Made-to-order model. Parcel placement requires dimensions for a specific version.
View the manufacturer’s modelDifferent materials, sizes and packages. You choose the supplier.
Find carport locations on your property and compare access, buildings, trees and sunlight. Choose a model, review estimated energy production, a visualization and a PDF report. Start with an address, parcel identifier or a point on the map.
kWp describes panel capacity. kWh measures energy produced over a period. Annual and monthly forecasts use the model, roof orientation, solar data and estimated obstacle shading. They are estimates, not guaranteed production. Two locations for the same model can produce different amounts. The chart shows generation, not household consumption.
The selected model and location, a property plan, alternative comparisons, energy estimates, shading maps, available visualizations and pricing information. When price and PV capacity are available, it also includes cost per kWp. The report is a preliminary concept for a supplier discussion, not a binding quote or construction design.