A location that works
Compare spots based on entry direction, manoeuvring space, buildings, greenery, surfaces and terrain.
AI property analysis
WIATEX
See where a WIATEX carport can make the most of your property. Compare suggested locations, vehicle access, seasonal shade and estimated energy production. Get a visualization and report, then discuss the offer and installation with WIATEX.
Check your property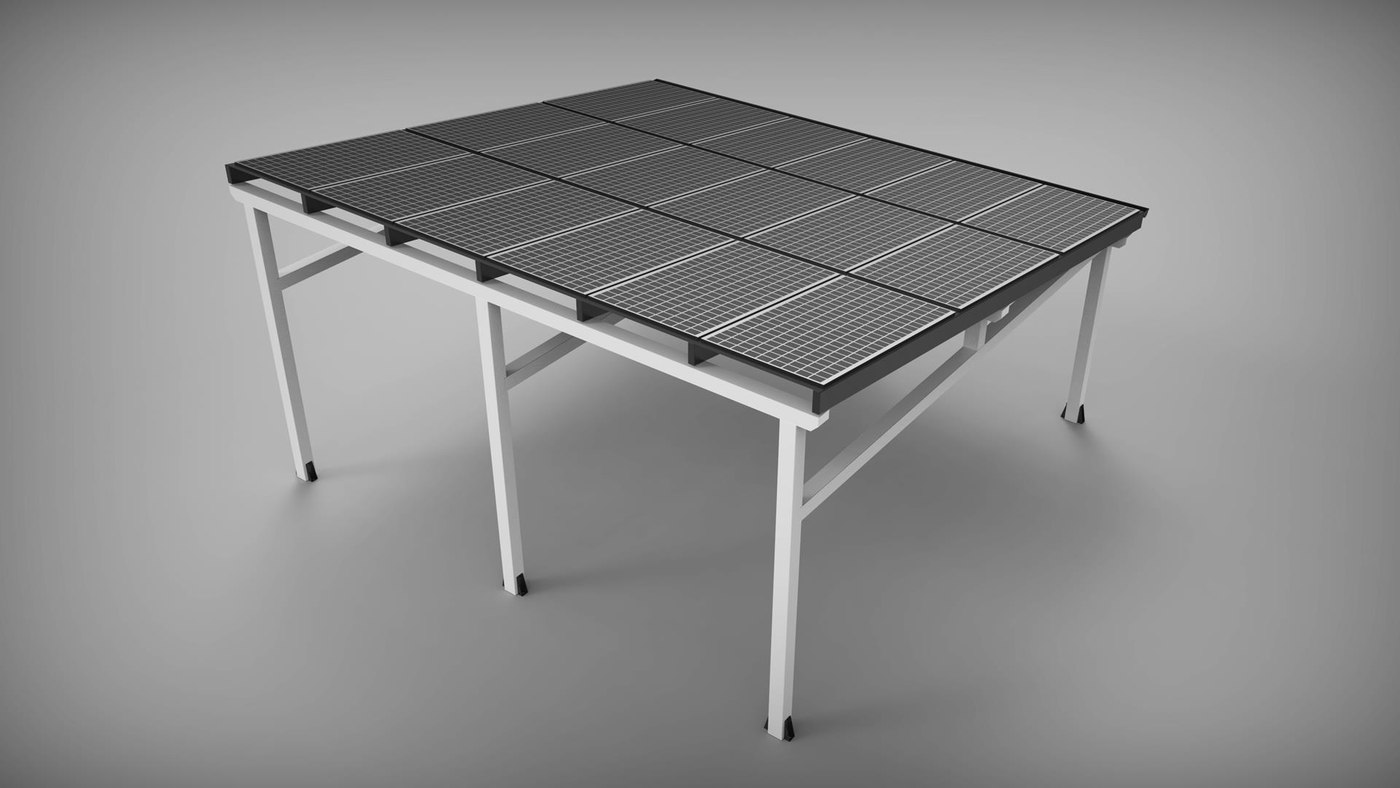
WIATEX Adelajda
Compare spots based on entry direction, manoeuvring space, buildings, greenery, surfaces and terrain.
Explore annual and monthly forecasts for the leading placements, plus shade maps for different seasons.
A visualization, placement comparison, energy forecast and initial estimate in a PDF report, ready to discuss with WIATEX.
WIATEX
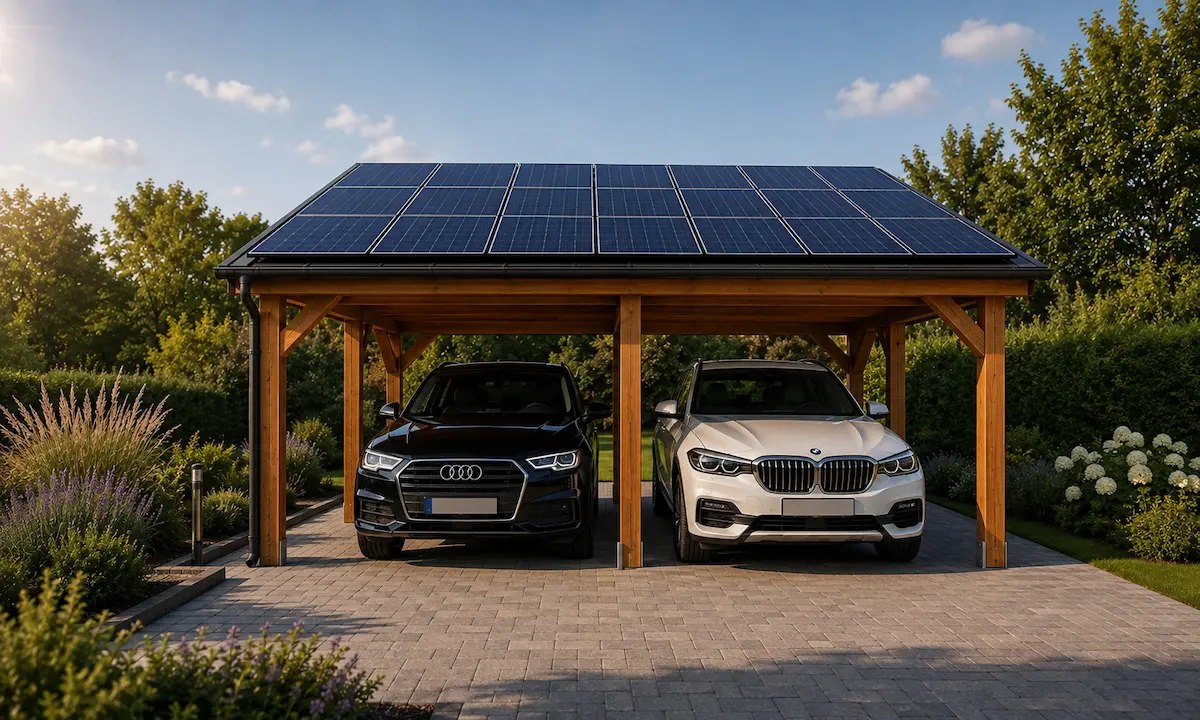
6 × 6 m · 2 spaces
PV-ready structure. Panels and the PV installation are specified and priced separately.
Individual quotation required.
WIATEX
Dimensions tailored to the project
PV-ready structure. Panels and the PV installation are specified and priced separately.
Individual quotation required.
Made-to-order model. Parcel placement requires dimensions for a specific version.
View the manufacturer’s model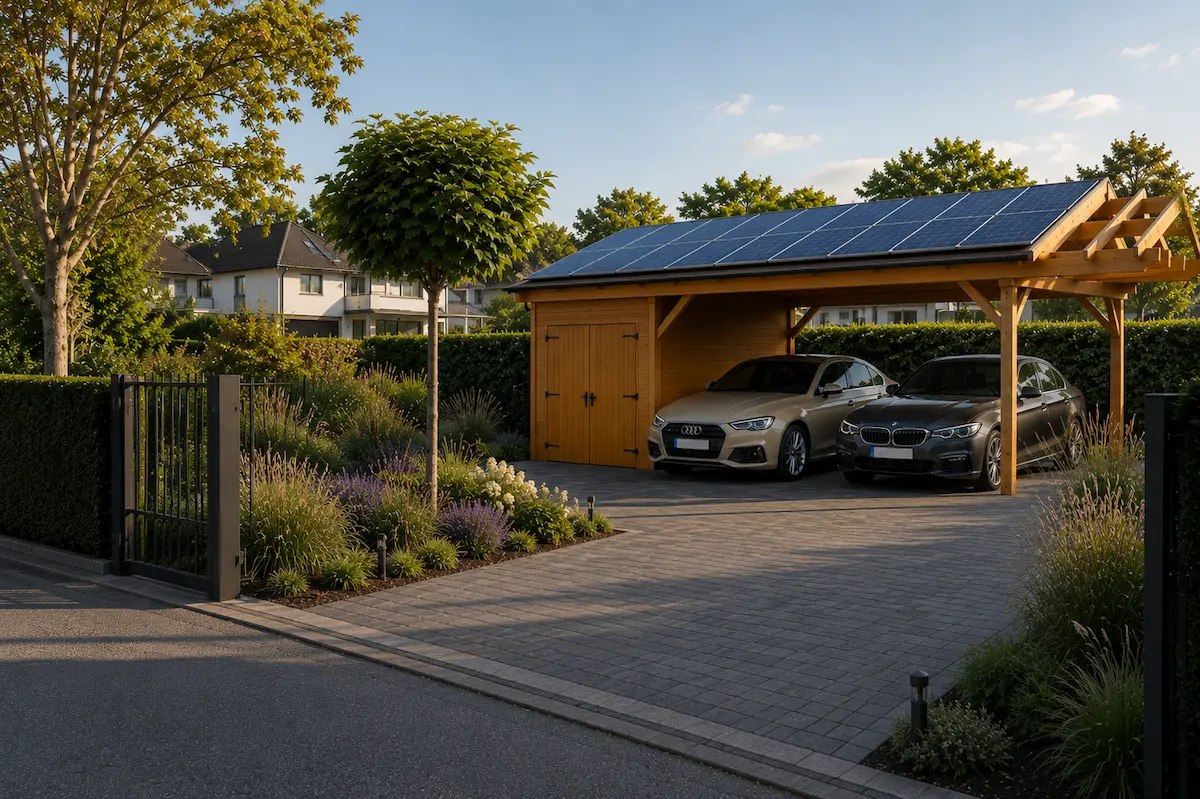
WIATEX
Dimensions tailored to the project
PV-ready structure. Panels and the PV installation are specified and priced separately.
Individual quotation required.
Made-to-order model. Parcel placement requires dimensions for a specific version.
View the manufacturer’s modelFind carport locations on your property and compare access, buildings, trees and sunlight. Choose a model, review estimated energy production, a visualization and a PDF report. Start with an address, parcel identifier or a point on the map.
kWp describes panel capacity. kWh measures energy produced over a period. Annual and monthly forecasts use the model, roof orientation, solar data and estimated obstacle shading. They are estimates, not guaranteed production. Two locations for the same model can produce different amounts. The chart shows generation, not household consumption.
The selected model and location, a property plan, alternative comparisons, energy estimates, shading maps, available visualizations and pricing information. When price and PV capacity are available, it also includes cost per kWp. The report is a preliminary concept for a supplier discussion, not a binding quote or construction design.